
The BARR model is the first and only school-improvement intervention to successfully climb the three tiers of evidence required under the U.S. Department of Education’s Investing in Innovation (i3) program.

What happens when adults in a school are given the tools to understand each and every student as whole person with individual strengths and unique academic and personal needs? We were determined to find out.
Just as we believe in the power of data to shape instruction, we have always been committed to rigorous evaluation to understand whether the BARR model is working and how to keep strengthening it.
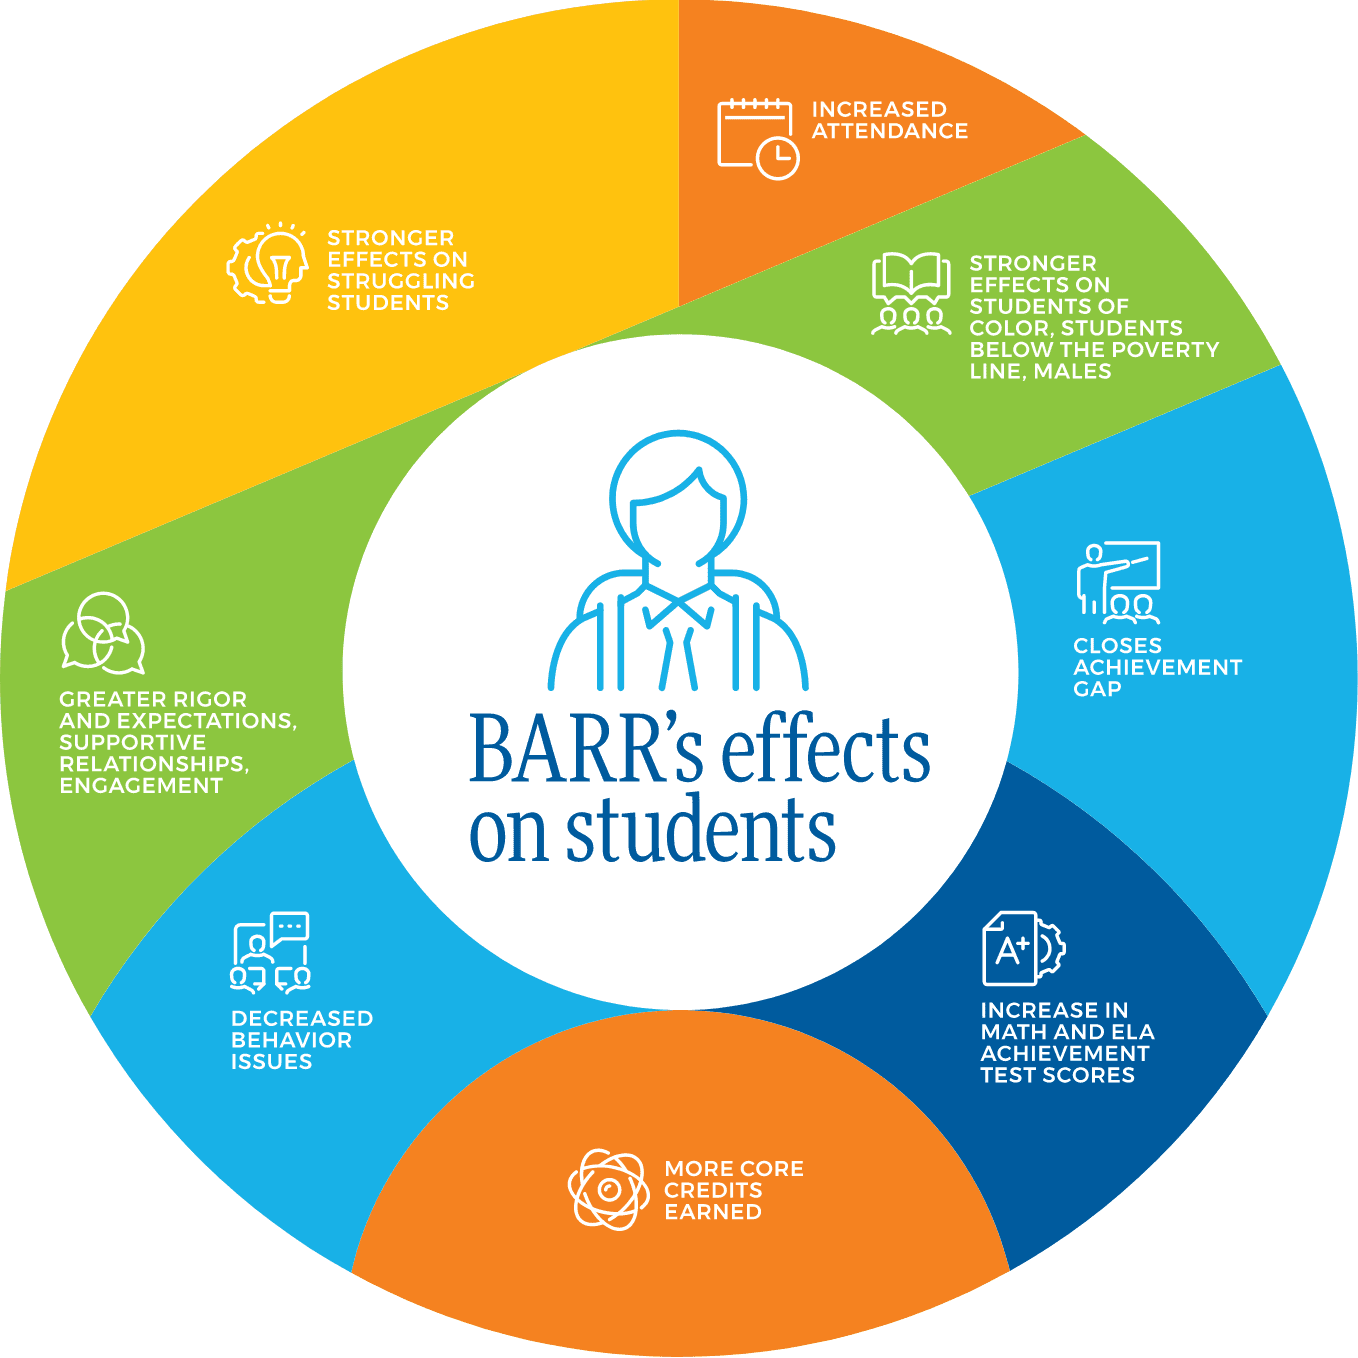
At BARR, because we are fact-driven, we’ve done the hard work of testing our model, and the data really does speak for itself. Through 12 within-school randomized controlled trials and 18 years of data at the school of origin, the BARR model has shown statistically significant impacts in 19 areas of academic performance and outcomes for students, teachers, and schools.
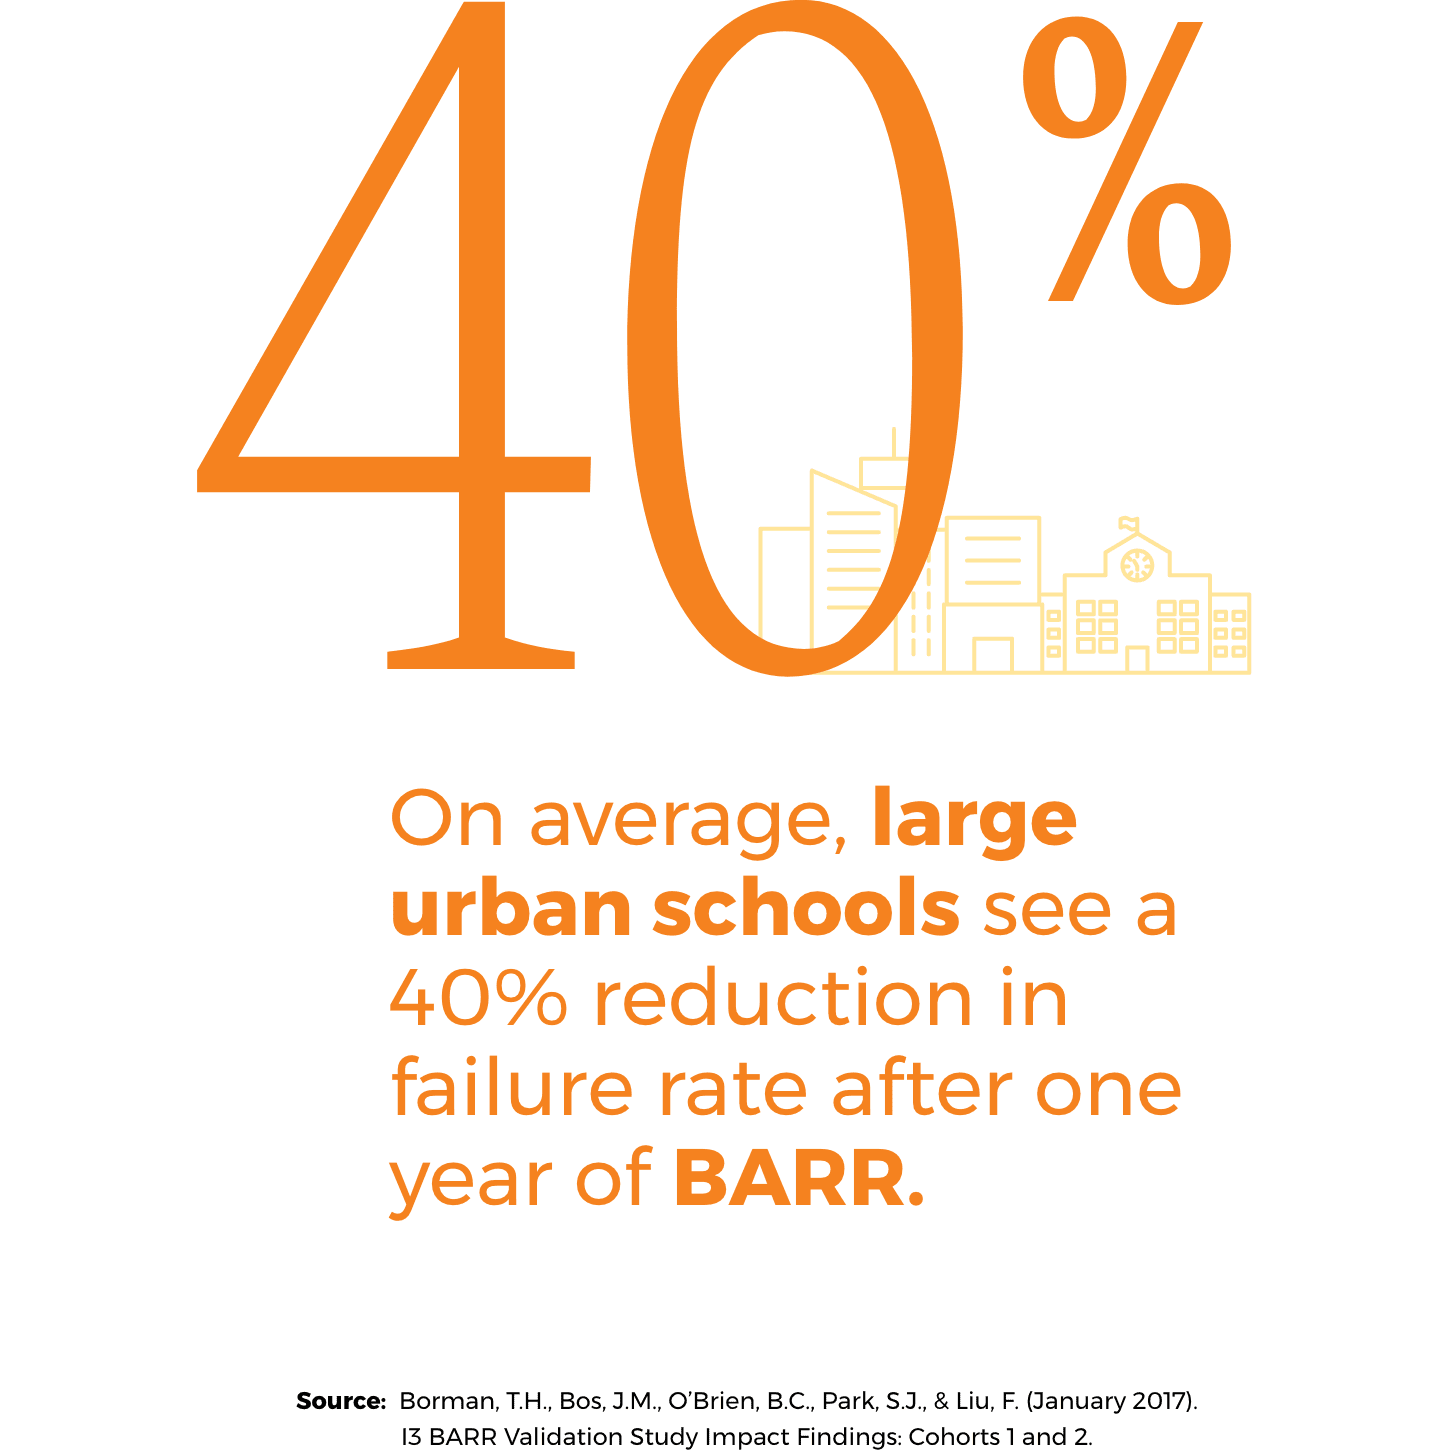
On average, large urban schools see a 40% reduction in failure rate after one year of BARR while smaller rural schools see an 29% reduction.
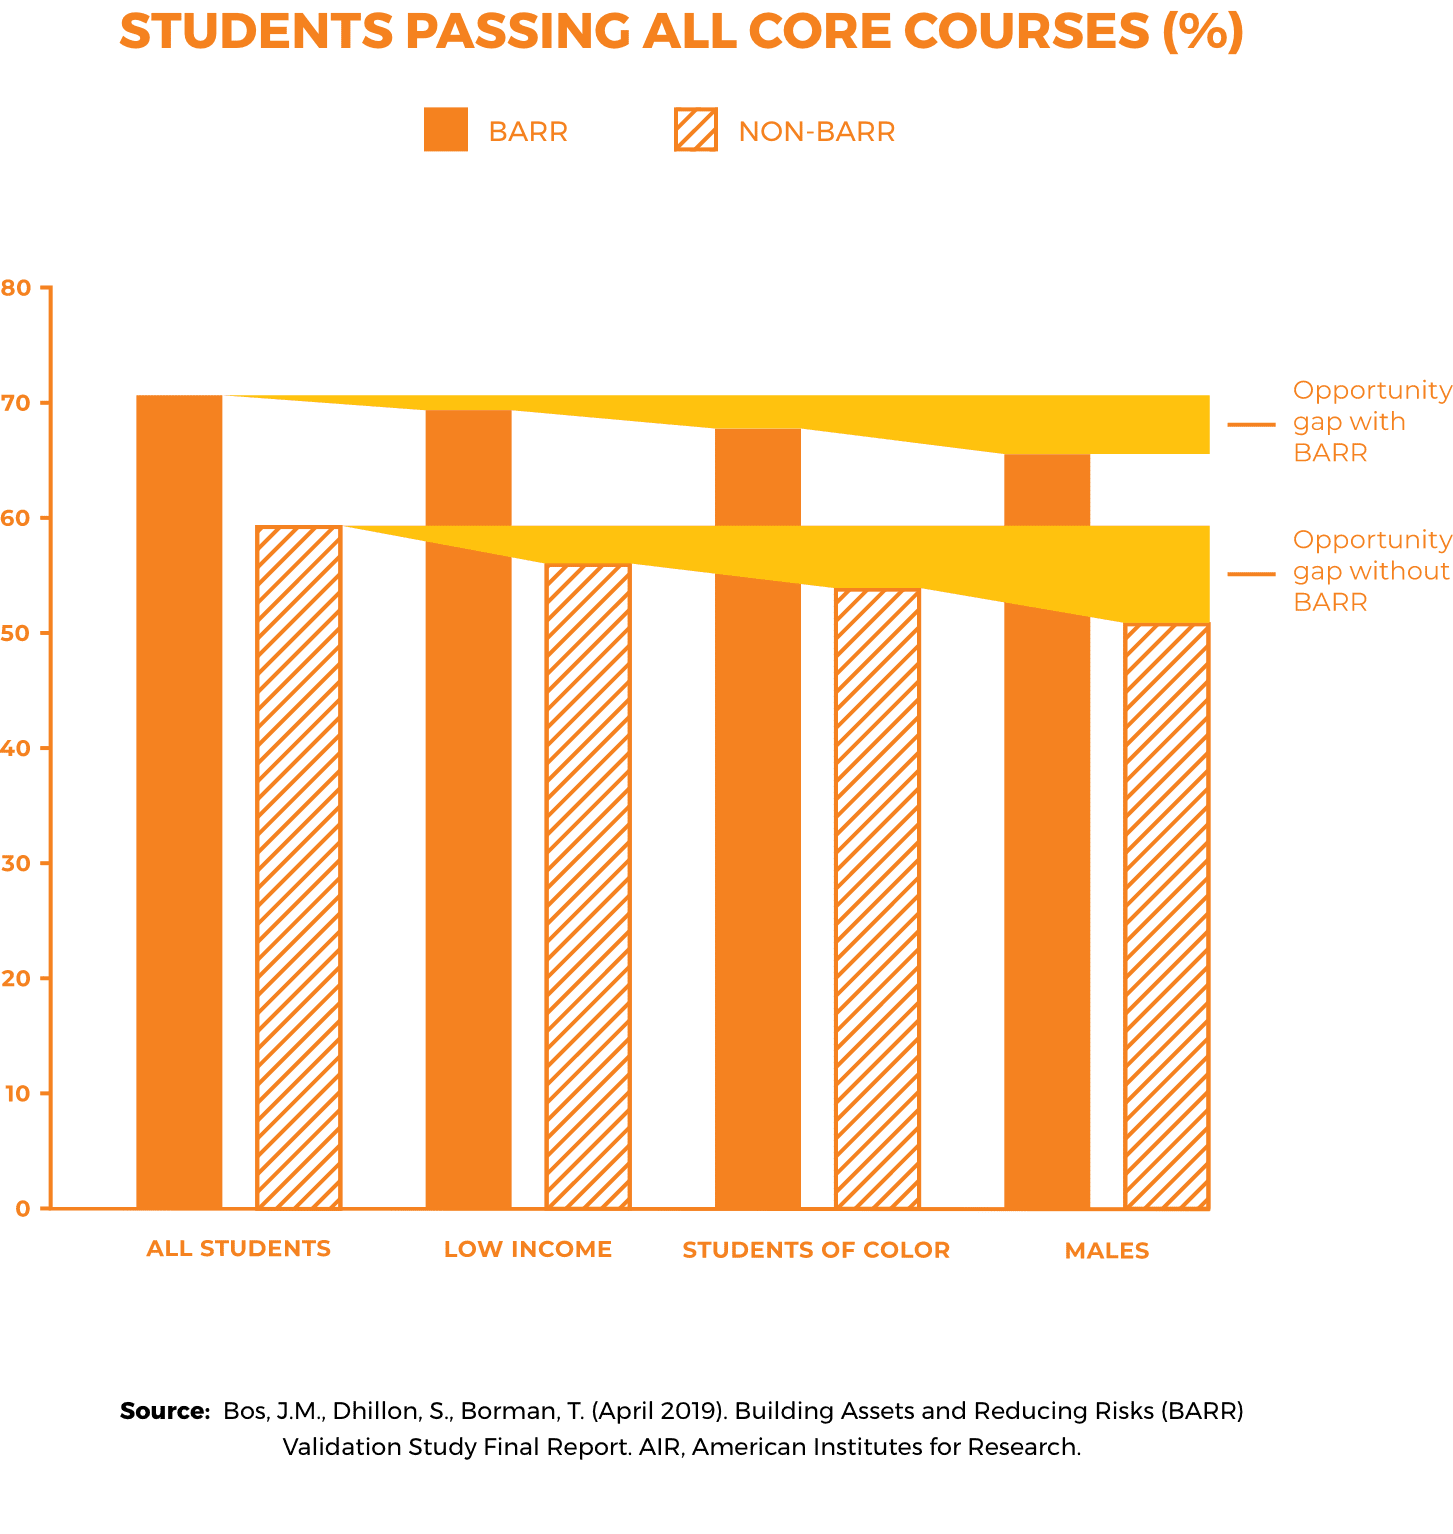
An independent study of more than 1,800 randomly assigned high school freshman found that more than 42 percent of non-BARR students failed at least one core course. For BARR students, that number fell to less than 30 percent. The effects were especially large for students of color, male students, and students from low income families (as measured by eligibility for free and reduced-price lunch).
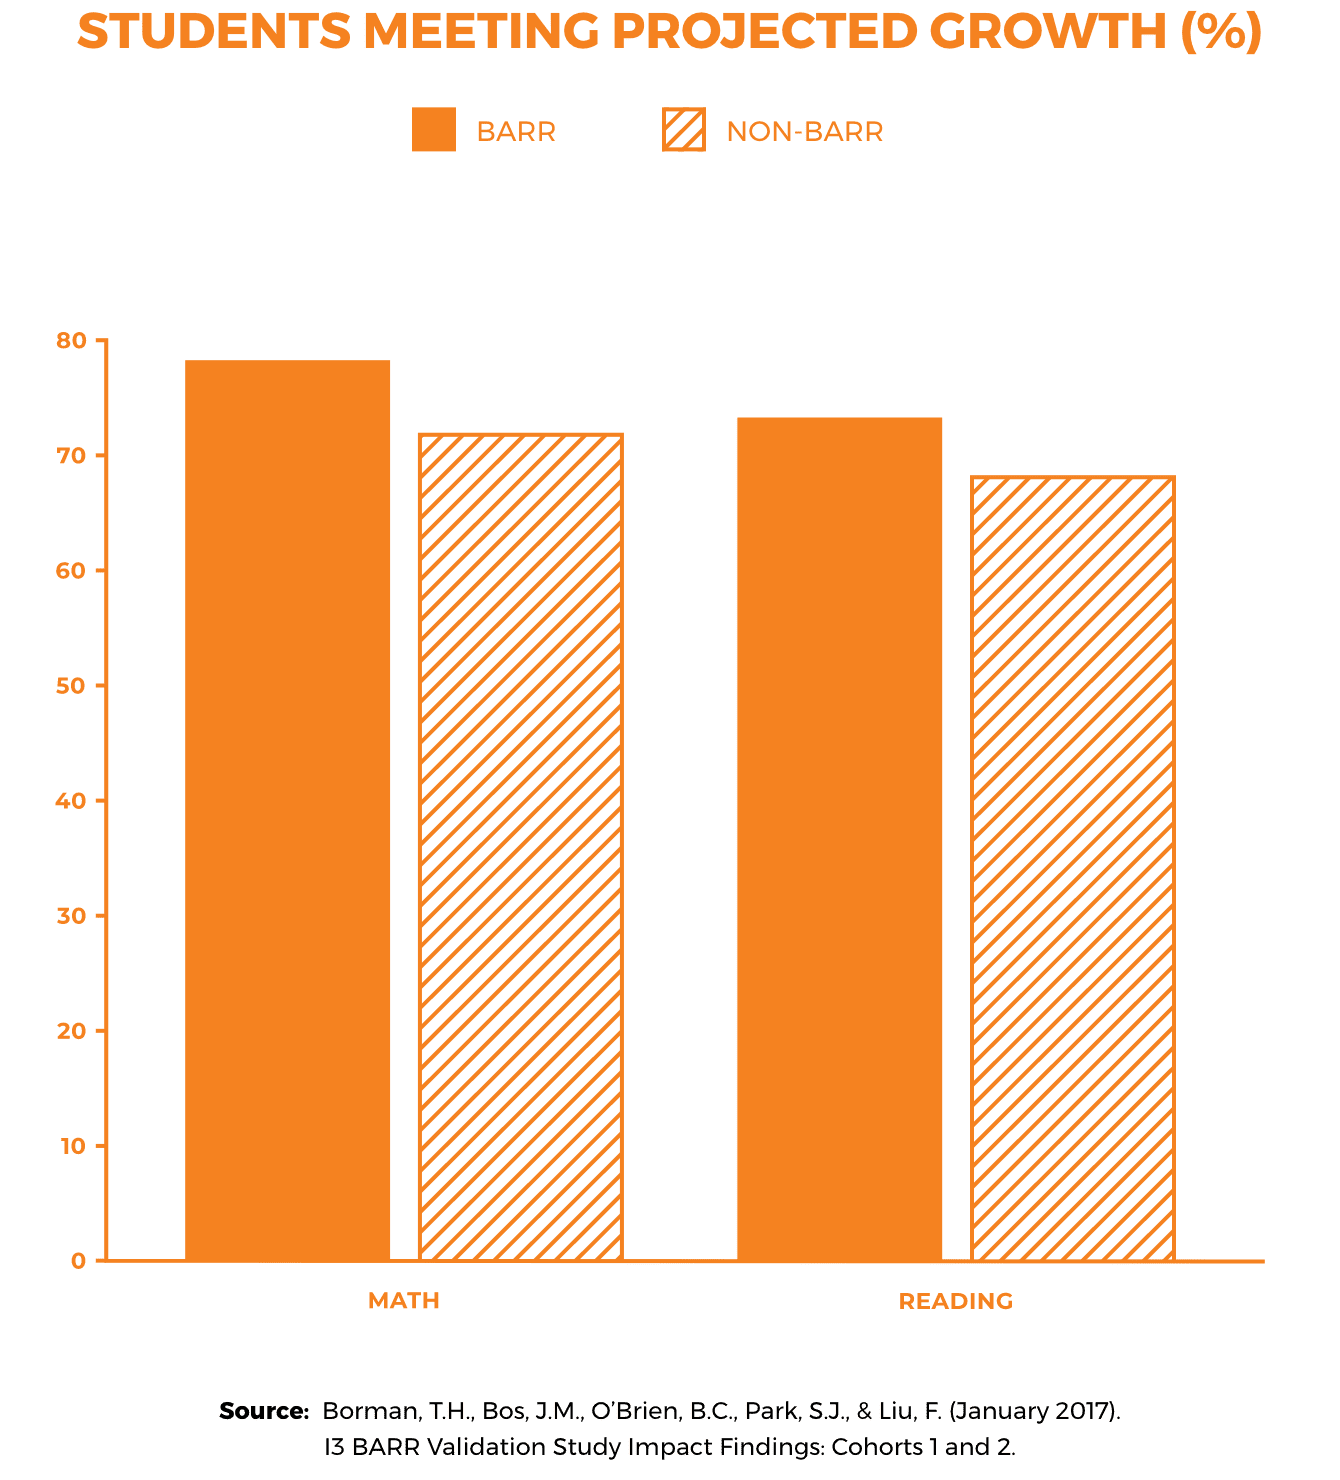
In a randomized control trial of more than 1,200 students, 78.6 percent of BARR students met projected math growth compared to 71.7 percent of non-BARR students. 73.3 percent of BARR students met projected reading growth compared to 67.3 percent of non-BARR students.
Equity is a core value of the BARR model, which has been shown to have especially powerful results in closing opportunity gaps for marginalized students. An independent study found that BARR helped narrow gaps in credits earned and passing rate for students of color and students from low-income families.
Compared to their peers, BARR students report increased expectations and support from their teachers. They also feel more deeply engaged in school.
BARR teachers report significantly better student behavior than non-BARR teachers.
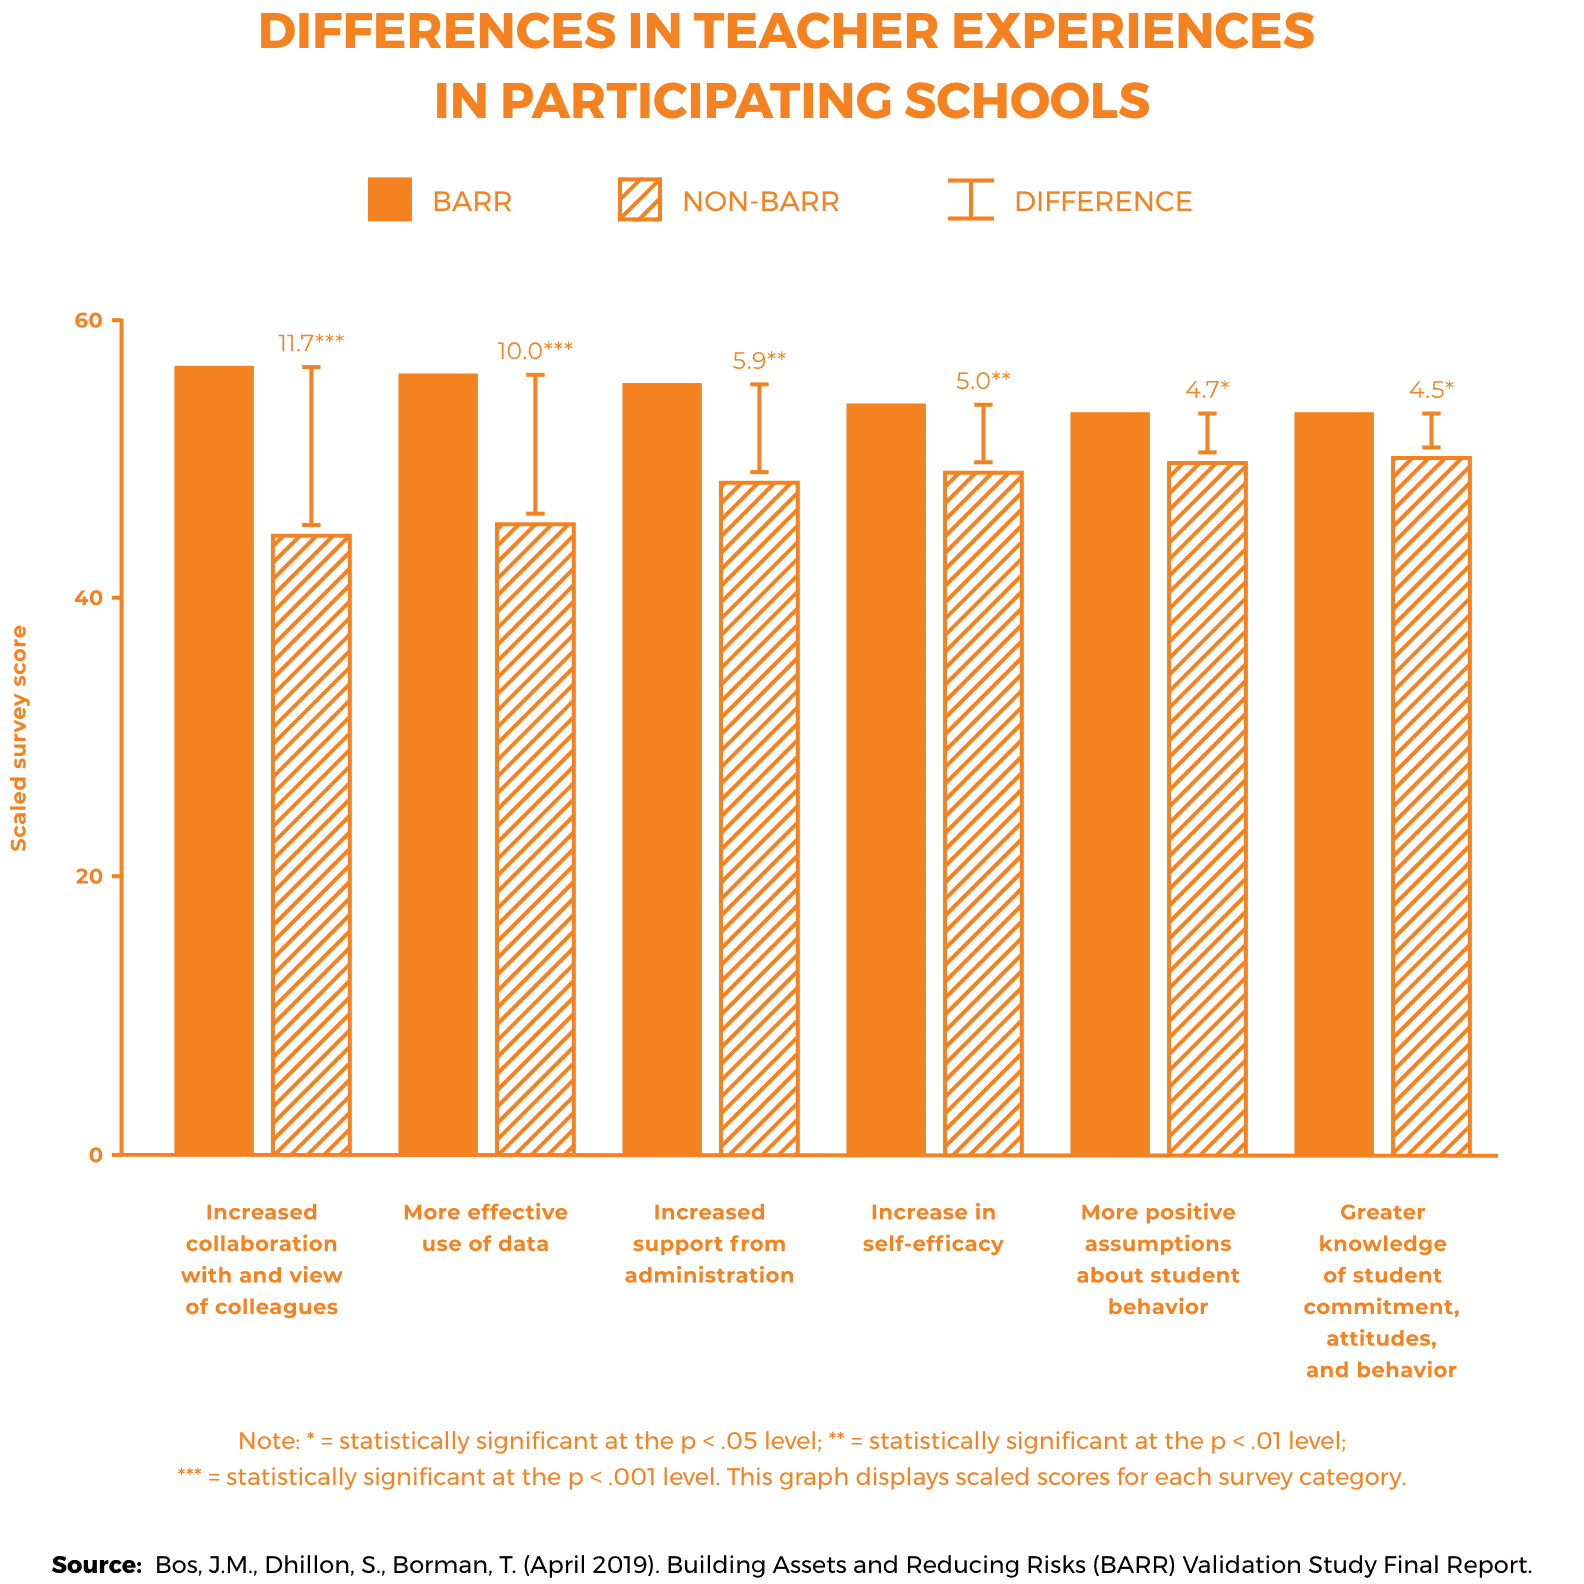
Compared to their peers, teachers who were assigned to BARR as part of a rigorous study by the American Institutes for Research reported that they felt better supported by their schools and more confident in their own work, collaborated better with and had an improved view of their colleagues, and made better use of data to inform instruction.
“I can’t imagine going back to what we used to do. I think the idea of working together in the block with these other teachers who have all the same students I do… I think we’ve opened our profession to work more with each other and talk about assessments and talk about standards we have in the classroom and expectations…Teaming, our block time, planning out how we’re going to intervene with kids has been phenomenal.”
— Bill Tracy, social studies teacher, Bucksport, Maine
BARR has been honored nationally for its proven and transformative model through several important recognitions. Each recognition highlights BARR’s commitment to utilizing real-time data to build intentional relationships with students and educators.
The BARR model is the first and only school-improvement intervention to successfully climb the three tiers of evidence required under the U.S. Department of Education’s Investing in Innovation (i3) program.
The BARR model has met the Evidence for ESSA requirements for “strong evidence” four times in reading and math impacts and one time in social-emotional learning.

BARR received the 2014 ACT College and Career Transition Award.
The U.S. Department of Education’s What Works Clearinghouse review concluded that BARR’s research “met evidence standards without reservation,” the highest possible WWC rating, in three separate studies.
BARR is listed in the CASEL Guide as a SELect Program, which is the top designation a program can earn for meeting or exceeding all of CASEL’s criteria for high-quality SEL (social and emotional) programming.

BARR is included in the Substance Abuse and Mental Health Services Administration (SAMHSA) National Registry of Evidence-based Programs and Practices (NREPP).